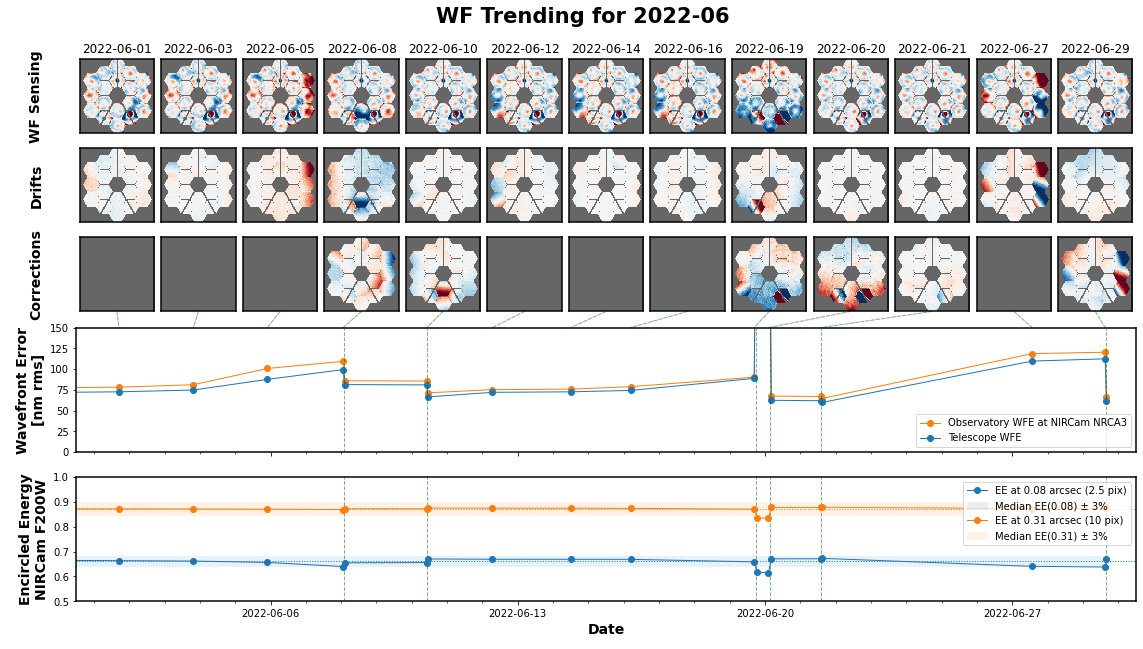
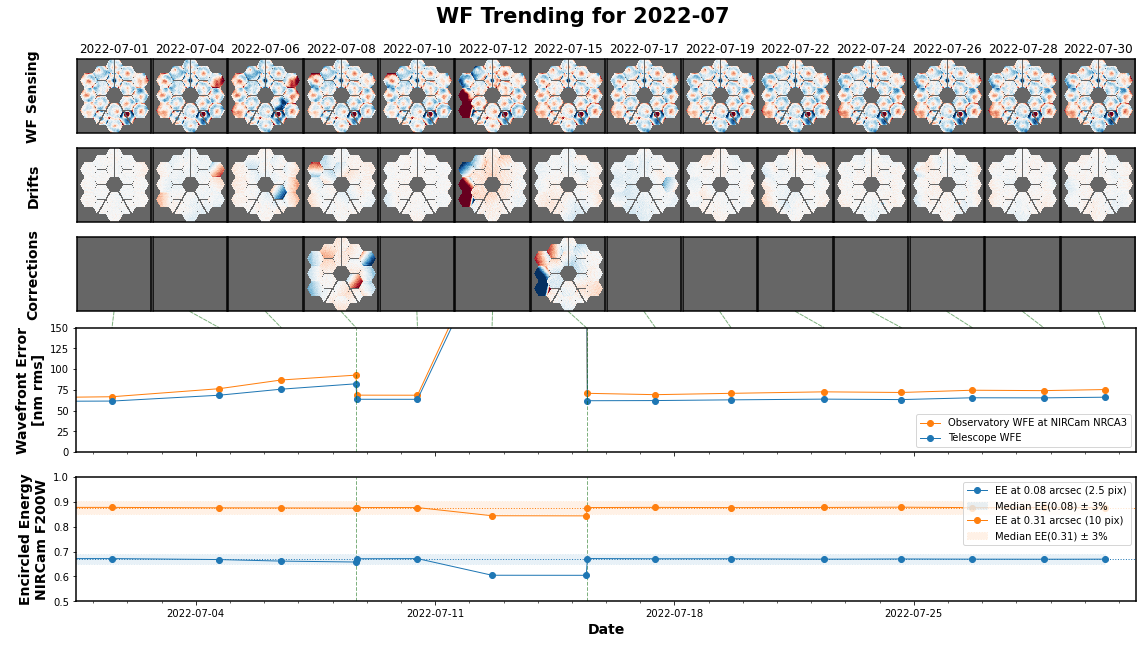
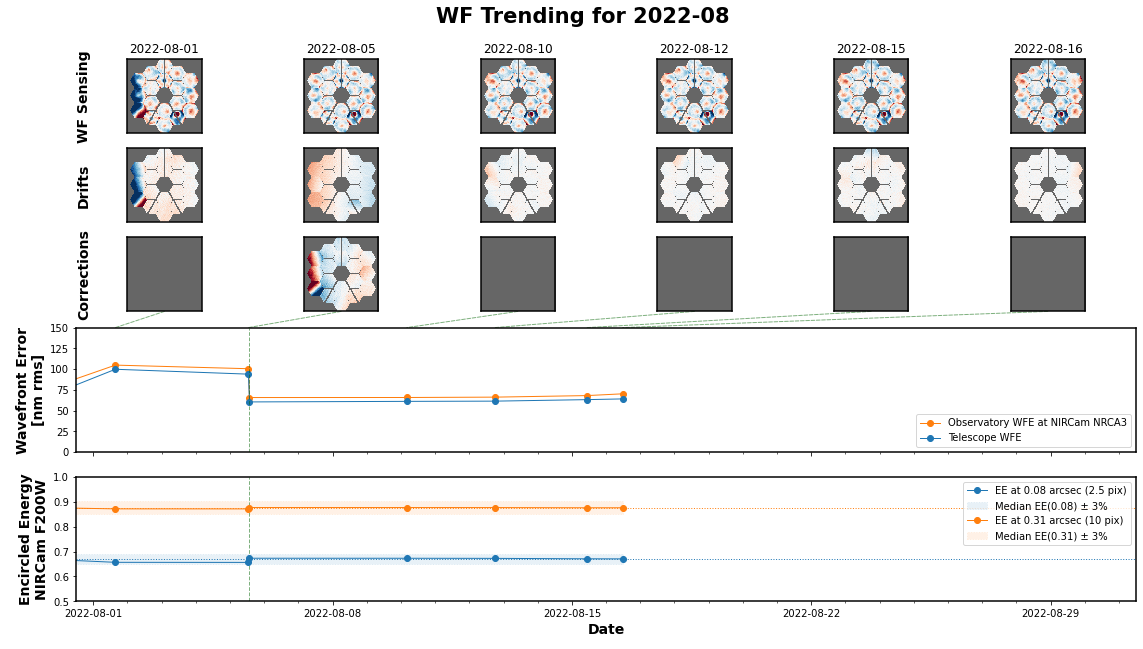
Plots of JWST Wavefronts Over Time
This page shows plots of JWST wavefront measurements over time, for reference. This page may be periodically updated as time goes on.
The plots shown here will likely not include the most recent measurements as of whatever time you’re looking at this page, but you can run the code in WebbPSF yourself to generate updated plots at any time.
[2]:
for month in [6,7,8]:
    webbpsf.trending.monthly_trending_plot(2022, month, verbose=False)